

Why the right amount of leverage is typically not zero, and typically not the maximum possible
By Fortitude Investment Partners
Fortitude's house view
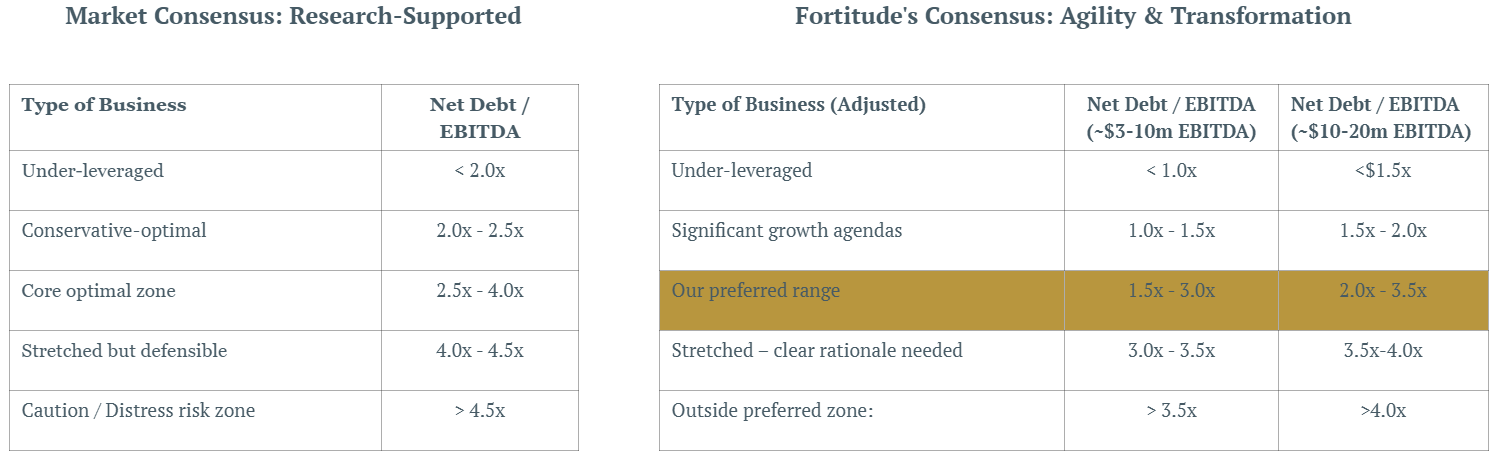
For a private equity-backed business generating $3-20M EBITDA, the optimal amount of debt is typically not zero; and it is not the maximum a lender will provide. Academic research and market evidence place the value-maximising zone for most businesses in this segment between 2.5x and 4.0x Net Debt / EBITDA. Our view sits deliberately below this: we target 1.5x-3.0x for the businesses we back, at entry. The difference is not scepticism about the tax benefits of leverage; it is a clear-eyed view that for SMEs, agility is the primary competitive weapon, and too much debt blunts it.
Our key findings are as follows:
Businesses below 1.0x Net Debt / EBITDA are typically under-leveraged relative to their debt capacity. We believe that the agility required to build management teams and successfully guide businesses through material transformation during the hold period is directly undermined by excessive debt.
Above 3.5x, the maths still works on paper, but the management bandwidth consumed by the balance sheet starts costing more than the interest savings are worth.
Above 4.5x, the tax and distress economics can begin working against you regardless of management quality. The Australian private credit market in 2025-26 is deep and well-priced for quality businesses. That said, in Fortitude’s view, access to cheap debt is not the same as a reason to use it.
1. Why Debt Hits Harder in PE
Debt Amplifies Equity Returns
The Leverage Multiplier
If a business grows its enterprise value by 30% over five years, a 100% equity investor earns a 30% return on invested capital. An investor using 60% debt and 40% equity earns substantially more, because the same EV gain flows entirely to the equity. This is the basic effect of financial leverage. It works in both directions. A business that underperforms its projections with high leverage can destroy equity value very quickly.
Debt Reduces the Cost of Capital
The Tax Shield
Interest on third-party debt is tax-deductible in Australia. Dividends and equity returns are not. At the Australian corporate tax rate of 30% (for non-base-rate entities), every $1M of annual interest expense generates a $300K annual tax saving — permanently, for as long as the debt is outstanding. Graham (2000) estimated the present value of this tax shield at approximately 9.7% of firm value for the average US corporation.¹ Applied to a $40M enterprise value business, that is a $3.9M benefit. This is real money that under-leveraged businesses are leaving on the table.
Debt Imposes Discipline
The Forcing Function
Jensen (1986) identified what he called the 'free cash flow problem':² management teams with excess cash tend to over-invest in marginal projects. In our view, a structured debt facility, with regular interest payments and amortisation obligations, forces rigorous capital allocation and reduces value-destructive or “lazy” investment. We believe this is at least part of the reason PE-backed businesses with moderate leverage consistently outperform non-PE peers on operating metrics.
However, speed is the real weapon
Smaller businesses do not typically compete with large enterprises only on resources, brand, or distribution scale. In our view, they compete primarily on agility. Leaner reporting lines, faster decision-making, the ability to reprice a contract, pivot a product, or respond to a customer within days rather than quarters. We see this responsiveness as the genuine competitive advantage of a well-run SME, and it is one of the primary reasons that PE-backed businesses in the $3-20M EBITDA range can grow faster and create more value per dollar invested than their larger, more bureaucratic peers.
Excessive debt can directly erode this advantage. A management team spending significant time on lender reporting, covenant monitoring, waiver negotiations, and balance sheet management is a management team not spending that time on customers, competitors, and opportunities. The hidden cost of over-leverage in an SME is not just the interest bill, it is the strategic attention that the balance sheet consumes.
Fortitude's house view: headroom by design
The businesses Fortitude backs are typically going through significant transformation. This kind of transformation demands that leadership attention is fully directed toward the business. We deliberately seek to size debt so that lender management is not the primary focus in day-to-day leadership. We believe this directly translates into faster transformation, more decisive execution, and better outcomes at exit. This is why our house view sits approximately 1.0x below the academic and market consensus on optimal leverage. It is not conservatism for its own sake. It is a deliberate choice to protect the competitive asset that makes these businesses worth owning in the first place.
A bolt-on acquired at year two with equity headroom creates far more value than one deferred or missed because the balance sheet was already fully drawn. We would rather carry slightly more equity cost at entry and own the optionality, than optimise entry leverage and find ourselves constrained when the right acquisition presents itself.
Not every situation plays out as expected, particularly where a significant transformation agenda is underway. Sometimes the plan must hold up against what happens when a business is “punched in the face” — we return to this later.
2. The Research Behind the Numbers
The Trade-Off Theory: Where Optimal Sits
The dominant academic framework; which is the Trade-Off Theory (Modigliani & Miller, 1963; Frank & Goyal, 2008;³ Kraus & Litzenberger, 1973) holds that firm value is maximised at the point where the marginal benefit of the interest tax shield equals the marginal cost of financial distress. Below this inflection point, more debt adds value. Above it, more debt destroys it.
For businesses with stable, predictable cash flows and experienced PE ownership, this inflection point sits higher than it does for equivalent non-PE businesses. Axelson et al. (2013) demonstrated that PE ownership can effectively reduce the agency costs of financial distress. This is presented as being due to active governance, concentrated ownership, and sponsor reputational capital substitute for some of the credit risk protections that lenders would otherwise price for.⁴
PE Leverage: The Empirical Evidence
Brown, Harris, Jenkinson and Kaplan (2021)⁵ found that when debt is measured as a share of deal enterprise value, higher leverage is associated with higher average returns. However, when leverage is measured as a multiple of EBITDA (as practitioners do), the relationship with performance is weak and negative above approximately 5.0-5.5x. At that level, the businesses tend to be highly leveraged relative to their earnings and have limited capacity for organic investment or market disruption.
For the mid-market specifically, Stegovec and Crnigoj (2023)⁶ found that well-run private businesses converge to leverage targets of 2.5x-4.0x Net Debt / EBITDA. Firms significantly below this range show faster voluntary leverage increases (the market is efficiently identifying under-levered businesses). Firms above it have faced greater refinancing pressure and slower earnings growth.
Andrade and Kaplan (1998)⁷ studied highly leveraged transactions and found that the costs of financial distress are real but manageable, provided leverage does not become excessive. The key finding is that there is a clearly identifiable zone of leverage that is genuinely value-maximising, and a zone beyond it where the maths reverses.
Interest Coverage: Can You Pay It Back?
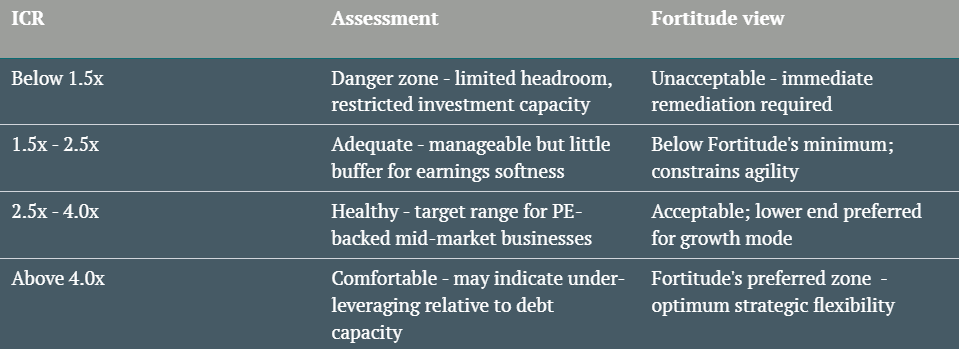
Net Debt / EBITDA tells you how much debt you carry relative to earnings. It does not tell you whether you can service it. That is the job of the Interest Coverage Ratio (ICR), calculated as EBITDA divided by annual cash interest expense.
In the current Australian rate environment, a business at 2.5x Net Debt / EBITDA, with a blended all-in cost of debt of 7.5% will carry an ICR of approximately 5.3x, providing substantial operational flexibility and covenant headroom. A business at 3.5x Net Debt / EBITDA carries an ICR of approximately 3.8x. Whilst this appears manageable, there is obviously less room to absorb commercial investments or a period of below-budget trading. At 5.0x leverage, ICR falls to approximately 2.7x. Although this may often be technically adequate, the balance sheet may become a constraint rather than an enabler.
3. The Australian Lending Market in 2025-26
Three Lender Types, Three Different Conversations
Unitranche has emerged as the defining product of the Australian mid-market in 2025-26. Investment banks have returned to centre stage arranging and underwriting, while private credit providers continue deploying with plentiful dry powder. The result is genuine competition between products and lenders, which is good news for borrowers with quality businesses and experienced sponsors.
Banks
The Big Four and regional banks remain the lowest-cost source of senior secured debt for businesses that fit “standard” credit parameters. For the $3-20M EBITDA segment, banks typically lend to 3.0-3.5x Net Debt / EBITDA, require full maintenance financial covenants, and price at a margin over BBSY (Australian Bank Bill Swap Rate). Speed and certainty are lower than private credit. Processes can take 8-12 weeks.
Private Credit
Australia's private credit market has grown dramatically. ASIC's September 2025 report estimates the domestic market at approximately AUD $200-210 billion across all strategies.⁸ Major domestic and offshore managers, including Metrics Credit Partners, Ares, HPS, Blackstone Credit and others. These lenders are actively competing for quality mid-market assets.
Private credit lenders typically provide unitranche facilities. These are (for the borrower) a single blended facility combining senior and subordinated economics. The facilities are at leverage up to 4.5-5.0x for strong credits. We understand unitranche pricing in early 2026 is broadly BBSY + 400-550bps for mid-market transactions, equating to all-in rates of approximately 7.5-9.5%. The premium over bank debt can reflect faster execution (4-6 weeks), greater structural flexibility, and higher leverage availability.
Mezzanine
For situations where leverage requirements exceed senior capacity, typically for bolt-on acquisitions or business plan-driven recapitalisations, mezzanine is available from specialist providers at all-in returns of 12-18% (combining cash pay and PIK). It can be the right tool when there is genuine equity upside to support it. Obviously costs imply that this lender type is not a mechanism for routine leverage optimisation.
What Lenders Focus On
Regardless of lender type, debt appetite and pricing comes down to five primary questions. Understanding how your business answers them is the key to both knowing how much you can borrow and negotiating the best terms.
Earnings quality and predictability – this may include recurrence of revenue, customer diversification, margin stability.
Free cash flow conversion – working capital cycles, maintenance capex requirements, tax obligations.
Security and collateral – lenders take a first-ranking fixed and floating charge over all assets. Asset quality and location (Australian versus offshore) affects thin cap analysis.
PE sponsor reputation and track record – an established local fund with strong lender relationships may access materially better leverage and pricing than an offshore or emerging manager.
Use of proceeds – acquisition debt for value-accretive M&A can be viewed differently from recapitalisation or dividend debt.
4. Leverage & Exit
The capital structure of the business at exit is not just the sponsor's concern. It can affect who bids for the business, at what multiple, and how much process friction the deal encounters.
McKinsey's 2026 Global Private Markets Report⁹ found that leverage and multiple expansion together comprised 59% of PE returns for deals done in 2010-2022. Importantly, the same research found that debt's share of deal enterprise value has declined from 44% in 2016 to 37% in 2025. We understand that this reflects both higher entry multiples and a structural shift toward operational value creation as the dominant return driver. The implication: a business that arrives at exit with a healthy balance sheet, both signals management quality and gives buyers maximum flexibility to apply their own leverage at acquisition.
Bain & Company reports that debt-to-EBITDA ratios for US LBO's averaged approximately 4.9x in 2024, well below pre-pandemic peaks.¹⁰ Businesses entering exit processes above 5.0x Net Debt / EBITDA have consistently attracted a narrower buyer universe and longer due diligence timelines as buyers price in the cost and friction of refinancing an inherited capital structure.
5. A Practical Framework: Finding Your Number
The ranges below show both the research-supported market consensus and Fortitude's house view, which sits approximately 1.0x below the market consensus to preserve SME agility and management bandwidth during transformation.
6. How This Changes Over Time
As a business evolves, balance sheet optimization should continue to be revisited. Whilst we do not want to encourage teams to be distracted by debt management each day, we consider good execution hygiene includes a review of balance sheet optimization at least quarterly, preferably monthly. We consider the following principles in this review.
Treating Acquisition Leverage as The Right Leverage Forever
Acquisition leverage reflects market conditions, deal structure, and sponsor return modelling at a point in time. It should be considered as market conditions continue to evolve.
In a lender-friendly market, the amount lenders will provide often exceeds optimal. Management teams should be buying only the leverage their business plan requires, not the maximum available. The question to ask is not 'how much can we borrow?' but 'how much do we need to execute the plan, with appropriate headroom?'
Maintaining optimization for competitive advantages: especially agility
As noted above, Fortitude’s view is that SMEs win on agility, not on scale. The ability to respond to a customer in 24 hours rather than two weeks, to reprice a contract in a single conversation, to pivot a product line without a six-month committee process. Over-leverage puts this competitive advantage under pressure.
This is the trade-off we protect against when sizing debt. In practice, that means revisiting leverage at the same cadence as other strategic priorities, rather than waiting for a covenant test or a lender call to force the conversation.
Optimising the Balance Sheet as The Business Evolves
We are conscious that we have set out benchmarks above for businesses within the range of $3.0-20.0m in EBITDA; and significant transformation is set to increase earnings to above this range over time. In Fortitude’s view, as businesses grow, management teams expand both breadth and depth of capabilities, earnings become more consistent, leverage should be increased.
Managing a 'Punch In The Face'
We are also conscious that sometimes, as Mike Tyson says, everything goes to plan until you are “punched in the face”. In those situations, we appreciate that the best outcome can be arrived at by managing through less than optimal circumstances; seeking to manage stakeholders for a mutually acceptable outcome. We of course hope to not be in these situations, however, we believe trust and relationships with management teams and lenders can assist for these situations to be most reasonable.
Conclusion
For private equity-backed businesses generating $3-20M EBITDA in Australia, the right amount of debt is neither zero nor the maximum a lender will provide. The peer-reviewed evidence and current Australian market data place the research-supported optimal zone for most businesses in this segment at 2.5x-4.0x Net Debt / EBITDA. Fortitude's house view sits deliberately below this at 1.5x-3.0x. As set out above, the rationale is specific to this segment and to how we invest.
The businesses we back are not passive assets. They are going through meaningful transformation: management teams being built or augmented, operating systems being upgraded, adjacent markets being entered, acquisitions being integrated. This transformation requires full leadership attention directed at the business. Excessive debt divides that attention. The cost is not just the interest bill, it is the management bandwidth consumed by lender reporting, covenant monitoring, and balance sheet conversations that should instead be spent on customers, competitors, and opportunities.
In our view, SMEs win on agility. SME’s have leaner reporting lines, make faster decisions, provide genuine customer responsiveness; all superior to their larger competitors. These are the competitive advantages that can allow a $10M EBITDA business to outgrow a $100M EBITDA competitor in a shared market. Too much debt can erode this. Our preferred leverage range is sized to keep the balance sheet from being the primary focus for day-to-day management, so leadership can stay focused on what actually drives value.
Businesses below 1.0x should evaluate whether incremental debt creates value. Businesses at or above 3.5x with earnings of ~$3.0-20.0m should be highly predictable and should have flexibility in their covenants relative to a realistic downside scenario, particularly one that involves a period of below-budget trading during a management or operational transition.
The market consensus says 2.5x-4.0x is optimal. We think the right number for the businesses we back is typically 1.5x-3.0x, at beginning of the partnership. The difference is not caution; it is a view about where value actually comes from in this segment. We believe that businesses that compound the most value over a hold period are not the ones that entered with the most leverage. They are the ones with the financial flexibility to execute their strategy without the balance sheet becoming the story.
We have direct experience implementing and managing debt structures across businesses in industrial services, professional services, healthcare, technology-enabled services, and consumer sectors. Our network of banking and private credit relationships spans the major Australian banks and key domestic and international direct lenders.
We are happy to discuss the relevance of our experience with capital structure decisions as they apply to your specific business — including evaluating your current leverage against the framework in this paper, preparing for a refinancing, or assessing debt capacity in the context of a forthcoming acquisition.
References
1. Graham, J.R. (2000). How big are the tax benefits of debt? Journal of Finance, 55(5), 1901-1941.
2. Jensen, M.C. (1986). Agency costs of free cash flow, corporate finance, and takeovers. American Economic Review, 76(2), 323-329.
3. Frank, M.Z. and Goyal, V.K. (2008). Trade-off and pecking order theories of debt. Handbook of Empirical Corporate Finance, 135-202.
4. Axelson, U., Jenkinson, T., Stromberg, P. and Weisbach, M.S. (2013). Borrow cheap, buy high? The determinants of leverage and pricing in buyouts. Journal of Finance, 68(6), 2223-2267.
5. Brown, G.W., Harris, R.S., Jenkinson, T. and Kaplan, S.N. (2021). Capital structure and leverage in private equity buyouts. Journal of Applied Corporate Finance, 33(3).
6. Stegovec, K. and Crnigoj, M. (2023). Optimal capital structure and leverage adjustment speed. EBR Journal.
7. Andrade, G. and Kaplan, S.N. (1998). How costly is financial (not economic) distress? Evidence from highly leveraged transactions that became distressed. Journal of Finance, 53(5), 1443-1493.
8. ASIC (2025). Private credit in Australia: Report REP 814. September 2025. Australian private credit market estimated at approximately AUD $200-210 billion.
9. McKinsey & Company (2026). Global Private Markets Report: Private Equity. February 2026.
10. Bain & Company (2024). Global Private Equity Report. Debt-to-EBITDA ratios for U.S. LBOs averaged approximately 4.9x in 2024, well below pre-pandemic peaks.