
By Fortitude Investment Partners
Executive Summary
Between late January and mid-March 2026, the listed software sector lost approximately US$2 trillion of market capitalisation in what the financial press has called the SaaSpocalypse. The iShares Expanded Tech-Software ETF (IGV) fell more than 20%. The S&P/ASX Technology Index lost close to half its value in the six months to late March 2026.
The cause is structural, not cyclical. AI agents can now perform task-level work — legal review, sales development, customer service, bookkeeping, junior analyst work — at acceptable quality and rapidly falling cost. The per-seat pricing model that underpinned twenty years of SaaS economics is, as a result, under genuine structural pressure.
This whitepaper makes three arguments. First, the damage in software is concentrated, not universal: horizontal tools built around headcount-linked task work have been re-rated sharply downward, while data infrastructure, vertical AI applications, and businesses with deep regulatory moats have held up on a relative basis. Second, AI’s impact on the real economy is a story of enablement, not disruption: Siemens, Nestlé, Apollo Global Management and the ambient-AI-scribe vendors are publishing quantified margin-expansion outcomes that do not feature in the SaaSpocalypse headlines. Third, the opportunity is disproportionately a lower mid-market opportunity, because AI value capture is 80% workflow redesign and only 20% technology — and workflow redesign is faster and cheaper inside a focused $50–200m EV business than inside either a legacy enterprise or a fragile startup.
Fortitude invests exclusively in the Australian and New Zealand lower mid-market, predominantly across four themes — Health and Wellness, Digitisation, Food and Beverage, and Energy Transition and Infrastructure and Industrial Services — all of which map directly onto the sectors where AI is functioning as an enabler. The SaaSpocalypse is an ending for a specific business model. For the lower mid-market, it is the beginning of what we think will be an unusually constructive investment environment.
PART I
The Forcing Function: What Changed in AI
1. The agent threshold
The AI story of 2023 and 2024 was a productivity story: generative AI sat alongside the worker as a “copilot”, and software companies charged a modest premium for AI-enhanced seats. The story of 2025 and 2026 is different. It is an agent story.
An agent is AI that does the work, not AI that helps a person do the work. Given a task — review these contracts, triage this support queue, generate this month’s financial close — a modern agent can plan the work, use the necessary tools, correct its own errors, and deliver the output with limited supervision. By early 2026 these are production capabilities, not theoretical ones, and the cost of running them has fallen roughly an order of magnitude each year since 2023.
The consequence for enterprise software is that the unit of work has changed. For twenty years that unit was a seat — a human, with a login, performing tasks inside an application — and software companies charged per seat because seats were the thing being sold. The agent breaks that equation. A business that deploys agents does more work with fewer seats, or more work with no incremental seats. That is why the market reaction in early 2026 was so violent: a specific technical threshold was publicly and demonstrably crossed, and the per-seat revenue assumption underpinning most SaaS valuations stopped being defensible.
2. Four mechanisms, unevenly distributed
Oliver Wyman’s research team published a useful framework in early 2026 separating AI’s impact on software into four overlapping mechanisms. Substitution: the model performs the core task directly — Photoshop is no longer the default for producing a marketing image when a prompt delivers a usable result in seconds. Competitive acceleration, or “vibe coding”: AI tools have dropped the cost of building functional business software by one to two orders of magnitude, narrowing the historical moat that software was hard to build. Agentic execution: the software is still there, but the human user is not — the agent logs into the CRM, updates records, sends the email, and the seat count decouples from the volume of work being done. Interface collapse: in the limit, the agent talks directly to the underlying database, API or ledger, and the application layer becomes vestigial.
These mechanisms are not hitting all categories equally, and that unevenness is the most important point in this section. Categories built around headcount-linked task work — sales development, entry-level customer service, tier-one legal review, bookkeeping, basic marketing ops — are squarely in the crosshairs. Categories built around systems of record, regulated data, deep vertical workflows, and network effects are much better insulated. A multi-year implementation of a healthcare records system is not being replaced by a weekend of vibe coding.
The evidence that this is operational reality, not just narrative, is visible in the software vendors themselves. Workday announced in February 2025 that it was laying off approximately 1,750 people — 8.5% of its workforce — in order to redirect investment into AI, and followed up in February 2026 with a further 2% cut and a change of CEO. The irony of a workforce-management software company reducing its own workforce because of AI was not lost on the market. The knock-on logic is what investors are really reacting to: if Workday can run its own HR with 8.5% fewer people, its customers can plausibly do the same — which means they need fewer Workday seats. The disruption is recursive. Every SaaS vendor that uses AI to become more efficient is implicitly telling its customers how to use less of its own product.
PART II
The Repricing: SaaS Valuations in the AI Era
3. The selloff
Between late January and mid-March 2026 the IGV fell more than 20%. SaaStr’s analysis put the total market-capitalisation destruction at more than US$2 trillion, calling it the worst software selloff ever in relative terms — exceeding the dot-com bust, the GFC and the 2022 rate-hike shock. The acceleration came on 29 January 2026 when OpenAI released Project Operator; Anthropic, which had launched Claude Cowork on 12 January, released open-source Cowork plug-ins the following day, and one estimate put the damage at approximately US$285 billion in the 48 hours that followed. A second leg followed in April 2026, attributed by Goldman Sachs to Anthropic's Claude Cowork plug-ins and Google's Genie 3 model. By that point software forward price-to-earnings multiples had fallen below the S&P 500 market multiple for the first time on record — from 84.1x at the 2020–2022 peak to 22.7x in March 2026.
4. Where the damage has concentrated
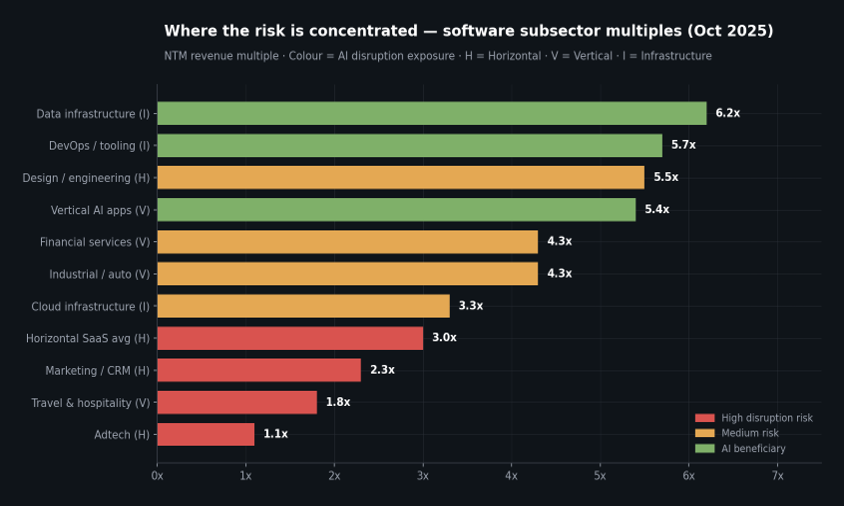
Figure 1. Software subsector NTM revenue multiples, October 2025. Sectors colour-coded by AI disruption exposure. Source: Multiples.vc (October 2025 report). Multiples are shown on a pre-selloff baseline; subsector levels have since moved lower and partially recovered, but the relative ordering has held.
The damage was not indiscriminate; it was concentrated. On the October 2025 baseline shown in Figure 1, adtech sat at the bottom of the distribution at just 1.1x forward revenue, travel and hospitality software at 1.8x, marketing and CRM software at 2.3x — the categories most exposed to agentic substitution. At the top, data infrastructure traded at 6.2x, DevOps at 5.7x, vertical AI applications at 5.4x. These are the AI beneficiaries: every agent needs a data layer, every team building agentic products needs DevOps, and vertical AI is how AI is actually delivered. In the middle sat industrial and financial-services software at 4.3x, cloud infrastructure at 3.3x — sectors where AI changes the operating model but does not obviously destroy it.
Public markets have already made their triage. Categories built around headcount-linked task work are being re-rated downward. Categories supplying the AI build-out are being re-rated upward. Categories with deep vertical workflows and regulatory or security moats are being held in place. Parts of the SaaS stack are under structural pressure, and the market has been quite precise about which parts.
5. The bifurcation between AI-native and legacy SaaS
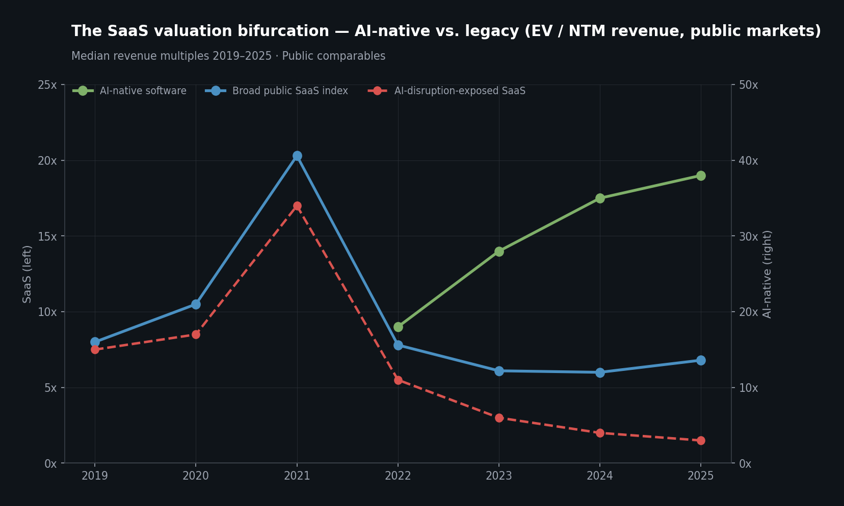
Figure 2. Median revenue multiples 2019–2025. AI-native software (right axis); broad public SaaS index and AI-disruption-exposed SaaS (left axis). Source: Eqvista / Crunchbase AI multiples (December 2025); Aventis Advisors SaaS Index; SaaS Capital Index (2025).
According to Eqvista, AI startups now command average revenue multiples of approximately 37.5x against a traditional SaaS multiple of roughly 7.6x — a gap that did not meaningfully exist before 2022. The median EV/Revenue multiple for public SaaS companies stabilised around 6.1x by mid-2025 per Aventis Advisors, above the 2023 low of 4.4x but still a fraction of the 2021 peak above 18x. The headline “SaaS multiple” is now an average of two very different populations moving in opposite directions. Both have since recovered ground: average enterprise value to 2026 estimated revenue across listed SaaS rose to 4.7x at the end of the June 2026 quarter from 3.9x in the March quarter, and to 4.0x on 2027 estimates from 3.4x.
6. The private-market consequence
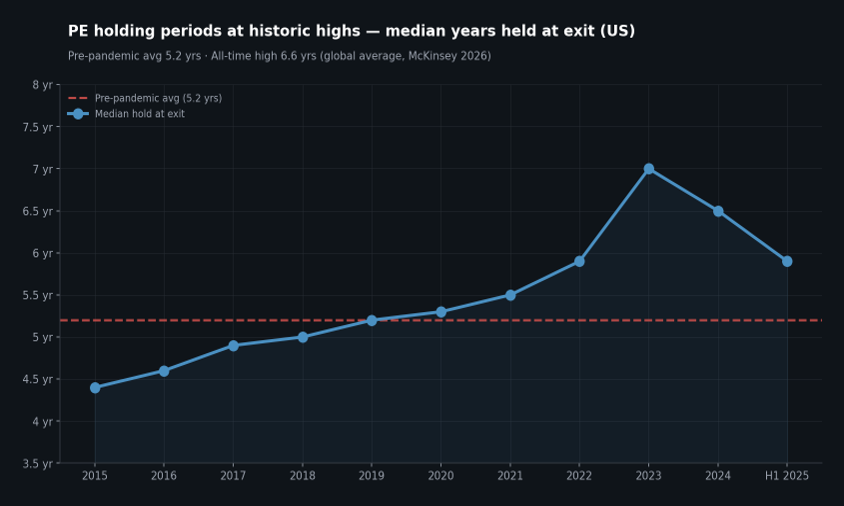
Figure 3. Median US PE-backed hold period at exit, 2015–H1 2025. Pre-pandemic average 5.2 years. Source: PitchBook via Cherry Bekaert PE Mid-Year 2025; McKinsey Global Private Markets Report 2026.
The public-market repricing matters for private equity for two reasons. First, private valuations eventually follow public comparables. Second, the public repricing has hit at a moment when the industry was already sitting on the largest unexited portfolio in its history. McKinsey’s Global Private Markets Report 2026 put the average global hold period at 6.6 years — the longest on record. More than 16,000 PE-backed companies globally had been held for four or more years by end-2025, equivalent to 52% of total buyout-backed inventory.
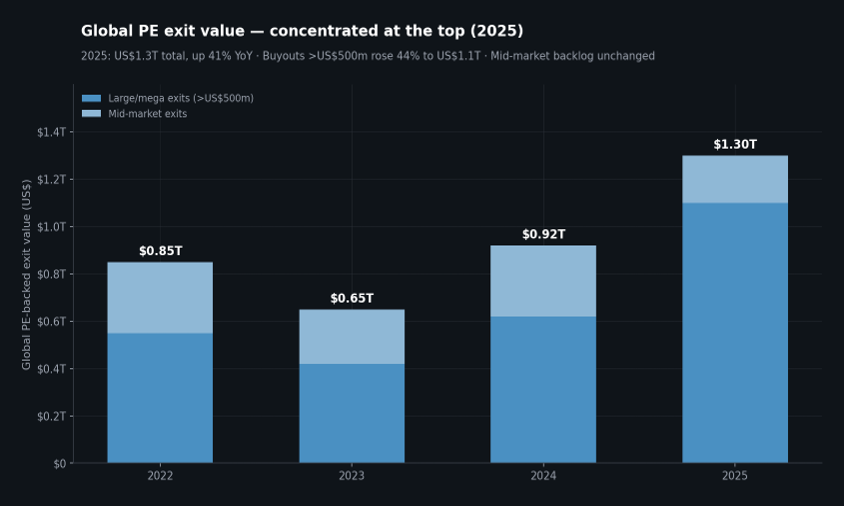
Figure 4. Global PE-backed exit value by year (US$ trillions), large/mega exits vs. mid-market. 2025 total US$1.3T, up 41% YoY. Source: McKinsey Global Private Markets Report 2026.
The 2025 exit-value recovery at the headline level was real — global exit value rose 41% to approximately US$1.3 trillion, the second-highest year on record. But the distribution was heavily concentrated at the top: buyout deals larger than US$500 million rose 44% in value, deals above US$2.5 billion rose 72%, and global PE deal count fell 9%. The mid-market exit window for ordinary non-flagship assets did not meaningfully reopen.
A PE fund sitting on a 2020–2021 vintage software asset, marked at acquisition multiples that assumed a 2025 exit at 8–10x revenue, now faces a public comparable set trading at 3–5x revenue for most of the stack. Distributions as a share of net asset value fell to 6% in the 12 months to June 2025, against a 2015–2019 average of 16% — the slowest pace of cash return on record, happening at the same time as the sharpest software repricing on record.
7. Overshoot or starting point?
Credible arguments exist on both sides. Goldman Sachs’ David Solomon characterised the February 2026 selloff as “too broad”: enterprise switching costs are real, and quality businesses with genuine AI integration are being sold alongside the genuinely exposed names. UBS took the opposite view, cutting ServiceNow from buy to neutral with a US$100 price target in April 2026, after the second leg of the selloff, on the view that the agentic disruption to enterprise software incumbents had further to run; ETR's CIO spending data showed AI's share of near-flat IT budgets rising from roughly 12% to 14% in a single year — reallocation funded in part by cuts to traditional SaaS contracts.
Our view is that both sides are partly right. The first-order repricing is real and will not reverse — seat-based pricing anchored to headcount-driven task work is under genuine structural pressure. But the second-order damage to businesses with vertical moats, governance and security guardrails, proprietary data and sticky workflows is likely overdone in places. Since we first formed that view the evidence has moved our way. Listed software rallied through the June 2026 quarter — SaaS comparables gained close to 19% on average, outperforming the S&P 500 — as the market accepted that most software companies will not simply be replaced by AI. The ASX technology index rebounded over the same period, led by the names that had been sold hardest. We would not, however, mistake a partial recovery for a round trip: software would still need to rise 40–50% on average to recover its losses since mid-2025, and the first-order repricing of seat-based pricing has not reversed.
For Fortitude’s investors, however, the most interesting story is what happens on the other side of this repricing — when AI stops being a threat to software business models and becomes a value-creation tool inside the traditional businesses we actually invest in.
PART III
The Pivot: AI as an Enabler in the Real Economy
8. Where the AI opportunity actually sits
The most useful framing we have found on this question is an 80/20 rule made explicit in PwC’s 2026 AI predictions: roughly 20% of the value from deploying AI comes from the technology itself; roughly 80% comes from redesigning the work around it. McKinsey’s State of AI 2025 research reaches the same conclusion by a different route: fundamental workflow redesign is the single strongest predictor of AI’s bottom-line impact. That insight tells you where the opportunity is really concentrated — in businesses that have workflows with enough routine task-work for AI to bite into, and that are small enough and lean enough that redesigning those workflows is feasible in a reasonable time frame.
Those are not the large-cap listed software companies. They are mid-sized industrial, healthcare, services, and specialist-technology businesses — where a CEO can sit in a room with an operations leader, identify the three highest-leverage workflows, and rebuild them around AI in quarters rather than years. This is why Apollo Global Management has documented AI-driven cost reductions of 40% in content production, 15–20% in lead generation, and 15% in customer care at its portfolio company Cengage, the educational publisher, as reported in MIT Sloan Management Review in 2025. And why 59% of PE firms told FTI Consulting's AI Radar for Private Equity 2024 survey that they now view AI as a key driver of value creation, outstripping traditional factors.
9. Industrials and specialist services
The clearest external example of AI-as-enabler in industrial businesses is Siemens’s Senseye predictive-maintenance platform. Senseye ingests machine condition data from existing factory sensors and uses machine learning to detect anomalies and forecast failures. Siemens and its users report up to 50% reductions in unplanned downtime and up to 55% improvements in maintenance efficiency, with payback often inside three months. BlueScope Steel is a documented Australian customer. BHP, separately, opened its first Industry AI Hub in Singapore in May 2025 to accelerate AI adoption across its operations; at its Western Australia Iron Ore sites, computer-vision systems on conveyors detect oversized material and foreign objects before they damage equipment — disruption events that historically contributed to more than 1,000 hours of downtime across the system.
The same playbook at our end of the market looks different in one respect: it is rarely about factory sensors. It is more often about taking the manual, repetitive, judgement-heavy work inside a specialist services business and rebuilding it around a technology platform with AI automation embedded. That is what one of our portfolio companies, ASF Audits, is doing. ASF is the largest specialist Self-Managed Super Fund audit firm in Australia, representing approximately 8% of a market that oversees $1.06 trillion in assets, with SMSF auditors co-regulated by ASIC and the ATO — the kind of regulatory moat we actively look for. We invested in April 2025; the thesis was platform-driven margin expansion plus a roll-up of smaller manual audit books migrated onto ASF’s proprietary platform. The business is transitioning to a new system called HubX, has appointed a full-time CTO to lead the work, and completed the acquisition of Partners Wealth Group’s SMSF audit book in April 2026. This is the playbook in miniature: regulated services business, proprietary technology platform, AI automation embedded in the workflow, roll-up strategy that turns each acquisition into a margin-expansion event.
10. Healthcare
Healthcare is the sector where AI’s real-economy impact has been most thoroughly documented. The most advanced use case is ambient AI clinical scribes — products like Nuance DAX (now Microsoft), Abridge, and Ambience Healthcare that sit passively in the consultation room, listen to the conversation, and generate a structured clinical note directly into the EHR. The numbers published through 2025 are striking. JAMA found a 30.7% increase in clinician wellbeing at Emory Healthcare. Intermountain Health recorded a 27% reduction in note time per appointment using Dragon Copilot. Cleveland Clinic’s Ambience pilot recorded a 25% reduction in note-creation time and a roughly 50% reduction in after-hours charting, results that led to a system-wide rollout to more than 4,000 clinicians. At Riverside Health in Virginia, Abridge drove an 11% increase in physician work relative value units and a 14% increase in documented HCC diagnoses — direct revenue capture under US billing.
The financial logic is the 80/20 insight in action. The AI is doing the easy 20% — speech-to-text, note generation. The real value comes from the other 80%: clinicians no longer spend two hours an evening on documentation, can see more patients per day, and capture revenue through better coding. This is not a story about replacing clinicians; it is a story about removing the administrative tax that has been eating into clinician productivity for a decade.
The healthcare case study in our own portfolio is Aged Care Decisions (ACD). ACD is a technology-enabled services business that helps Australian families find residential aged care, in-home aged care, and disability care for loved ones. It sits in one of the most structurally growing markets in the country: an ageing population, an expanding home-care package program, and a large fragmented NDIS opportunity. The business has just created a new technology role dedicated solely to implementing AI agents inside the operation — for the repetitive matching, qualification and follow-up workflows that have historically defined the cost base of a placement services business, and that AI agents have now demonstrated they can execute reliably.
11. Food and beverage
At the large-cap end, Nestlé has published more hard numbers on AI deployment than any other food and beverage business. Its AI-assisted product ideation system has compressed time-to-concept from roughly six months to six weeks. Its internal LLM, NesGPT, saves employees an average of 45 minutes a week. Nestlé USA's data-modernisation program with Deloitte has reportedly delivered more than US$200 million in business value.
The interesting question is what this looks like in the Australian lower mid-market. Per the Australian Department of Industry’s Q1 2025 AI adoption survey, manufacturing and agriculture lag the rest of the economy in AI awareness — not because the use cases do not exist, but because operators in these sectors have not yet had the time, capital, or specialist expertise to deploy them. We view that gap as the opportunity. The playbooks Nestlé runs at global scale are, individually, achievable for an Australian mid-market food and beverage business with sponsor support and a sensibly sequenced twelve-month plan. What those businesses typically lack is not the technology, which is commoditised, nor the capital, which is available. What they lack is the operating partner to help them run the plan. That, among other things, is what a lower mid-market private equity sponsor brings.
PART IV
Implications and Positioning
12. Implications
Three practical implications follow. First, the bifurcation is real and will persist. The change in software economics will not be reinstated. For allocators with listed-equity exposure to SaaS, positions need to be triaged: businesses with deep vertical workflows, governance and security guardrails, proprietary data and genuine switching costs are in a very different category from horizontal tools priced per seat.
Second, the AI opportunity has migrated from software to the real economy. The companies capturing meaningful AI value today are industrial, healthcare, food, and specialist services businesses using AI to rebuild their workflows and expand their margins. These are enabler stories, and they do not feature in the SaaSpocalypse headlines.
Third, the opportunity is disproportionately a lower mid-market opportunity. The 80/20 rule means AI value capture depends on how fast a business can rebuild its operations around it. That describes a well-run $50–200 million enterprise value business better than it describes either a two-billion-dollar legacy enterprise or a fragile ten-person startup. On a proportional basis the impact is also larger in the lower mid-market: a 10% cost reduction and 5% revenue uplift moves the EBITDA of a $20 million business meaningfully more than it moves the EBITDA of a $500 million business.
13. Fortitude’s positioning
Fortitude is a private equity firm focused exclusively on the Australian and New Zealand lower mid-market. We deploy $10 to $60 million equity investments into businesses with EBITDA between $3 million and $20 million and enterprise values below $200 million. We typically hold for three to five years. As at the date of this paper, the partners at Fortitude own 100% of the firm.
Our four primary sector themes — Health and Wellness, Digitisation of the Economy, Food and Beverage, and Energy Transition and Infrastructure and Industrial Services — are, not coincidentally, four of the sectors where AI-as-enabler is creating the most visible value today. We did not pick these themes in response to the SaaSpocalypse; we have been investing behind them for years. But the environment we find ourselves in has sharpened, rather than diluted, the thesis behind each one — visible in our own portfolio at Aged Care Decisions in Health and Wellness, ASF Audits in Digitisation, and the Australian mid-market adoption gap we see across Food and Beverage and Energy Transition and Infrastructure and Industrial Services.
The engine that connects our sector themes to actual value creation is our operating-partner network — more than 175 experienced domain experts engaged through diligence and, selectively, appointed to portfolio company boards. In a market where AI value creation is 80% about workflow redesign and only 20% about technology, access to operators who have done the work before is the binding constraint. It is the part of the model that is hardest to replicate, and the part we are investing most heavily in.
14. Conclusion
The SaaSpocalypse is a real event. It is not a cyclical correction; it is a structural repricing of a business model that was priced for a world that no longer exists.
But a repricing is not an ending. What follows a repricing is reallocation — of capital, of management attention, and of investor expectations. For Fortitude and for our investors, the reallocation we see is from the horizontal software layer that is being disrupted, into the real-economy businesses that are being enabled. That reallocation is already underway in our own portfolio. It is the thesis we are investing behind in the Australian lower mid-market, and in our view, it is where the most attractive risk-adjusted returns in private equity over the next five years are most likely to sit.
We will keep our investors updated as the thesis plays out.
Sources and Methodology
This whitepaper draws on publicly available research and commentary published between late 2024 and July 2026. Market-data references, including those presented in the figures, are taken from the sources cited in each caption. Key external sources used in this paper include: McKinsey Global Private Markets Report 2026; McKinsey State of AI 2025; PwC 2026 AI predictions; Aventis Advisors SaaS Valuation Multiples (January 2026); Multiples.vc Software Valuation Multiples (October 2025 and April 2026 reports); Eqvista AI vs SaaS Valuation Multiples (January 2026); Oliver Wyman “How Agentic AI is Reshaping SaaS Valuations” (April 2026); PitchBook / Cherry Bekaert PE Mid-Year 2025; ETR CIO spending survey data as reported in the financial press; SaaStr analysis of the 2026 software selloff; Goldman Sachs, UBS and Jefferies analyst commentary as reported in the financial press; The Nightly, the Australian Financial Review and Reuters coverage of the ASX technology selloff; the 2025 Workday SEC filings and press releases; Siemens Senseye case materials via GSDC Council and ARC Advisory Group; BHP May 2025 press release on its Industry AI Hub and BHP Insights (2026) on AI in mining operations; Abridge, Ambience Healthcare and Microsoft DAX case materials as summarised in JAMA, npj Digital Medicine and AHA coverage; Emerj and Food Industry Executive reporting on Nestlé; MIT Sloan Management Review reporting on Apollo Global Management’s portfolio AI initiatives; EisnerAmper and FTI Consulting reporting on private-company AI valuation dynamics; First Analysis vertical software valuation review (July 2026); Goldman Sachs commentary on the April 2026 software selloff; and the Australian Department of Industry Q1 2025 AI adoption dashboard.
Portfolio company references — Aged Care Decisions and ASF Audits — draw on Fortitude’s own quarterly reporting for the period ended 31 March 2026. Where figures are cited from those reports, they are unaudited and may be subject to revision.